The Poverty Maps
Great grandparents are, on the whole, remote creatures. To most of us they tend to be mythical, distant, or just plain forgotten. Good lord – did Granny have a mother? Who knew? Intellectually, if we ever bother to think about our forebears, we know that each one of us has a quota of eight, genetically connected great grandparents. This may seem like a ridiculous oversupply for a generation about which we may know very little.
By now you are wondering what this has to do with the concept of terroir and the mission of this blog. Have we turned Terroir into an homage for the BBC series ‘Who do you think you are?’ The essence of ‘somewhereness’, however, is as much about the people who influenced, guided and developed ‘somewhere’ in the past, as it is about those who currently inhabit it. So more nearly, we are talking about ‘Where do you think you are?’ or, in in today’s blog, ‘Where do you think you were?’
For Terroir does not spring from generations of Surrey farm labourers, millers, land owners or stockbrokers. We are the product of generations of economic migrants. Our multiplicity of great, great grandparents and great grandparents came from as far afield as rural Kent, Sussex, Cambridgeshire, Warwickshire, Staffordshire, Montgomeryshire and Caernarvonshire. And they were drawn through the industrial sweatshops of places like Wolverhampton, Liverpool, and Nottingham on their journey to a very much more diverse range of employments and locations in the 20th and 21st Centuries.
But all this talk of ancestor’s journeys is also a vehicle to explore something of national significance and interest - The Booth Poverty Maps of London - housed at the London School of Economics https://booth.lse.ac.uk/ and which must be one of the most extraordinary social mapping archives in the country.

Extract from Booth’s Maps Descriptive of London Poverty, 1898-9 Thames-side from Battersea Bridge to Vauxhall Bridge
The eponymous Charles Booth was born in Liverpool, the son of a corn merchant and, at the age of 16, was apprenticed to a shipping company. Up to this point he could perhaps have passed for one of Terroir’s ancestors, although I suspect that, in 1856, most of Terroir’s lot left school a whole lot earlier and were more likely to have been apprenticed to shop keepers.
Thereafter the story is very different from Terroir’s. Booth seems to have combined a sound business acumen with a desire for fair play, and developed ‘a profound sense of obligation and responsibility towards the poor and to the improvement of social conditions.’ https://booth.lse.ac.uk/learn-more/who-was-charles-booth After experiencing the shocking condition of the Liverpool slums it is hardly surprising that by 1886, he was proposing an inquiry into living conditions in London. Full details can be found on the LSE website noted above. If you don’t already know the archive, delve deeply. It is utterly fascinating.
So, let’s return to Great Granny and explain where she fits into Terroir’s exploration of the Booth maps. Terroir can just remember her – a terrifying, upright, fur clad, Victorian matriarch. There is a photograph of her and her extended family (she was one of thirteen children), at an event (party is too uninhibited a concept) to celebrate a significant parental wedding anniversary (golly - Great, Great Granny and Great, Great Grandad). It is summer and she is some 50 years younger than the fur clad memory, but there she is, a terrifying, upright, Victorian matriarch, having a bad hair day. All the other women present are having a bad hair day too, so it is obviously the fashion.


‘Scary Great Granny’ is important, not only because I can remember her, but also because she was the only Terroir ancestor living in London when Booth was surveying and mapping poverty. Actually, that’s not strictly true; another branch of the family had also made it to London by then, but they were living in Willesden, north of the railway station, and outside Booth’s area. So it was Scary GG (aka Millie) who became our focus for exploring the Booth maps and for comparing her late 1888/9 habitat with the same street in the early part of the 21st century.
According to the 1891 census, Millie and husband Charles, with their one year old daughter, were living at 29, Beaufort Street, Chelsea, London. It sounds promising. Millie was born in Cambridge, the daughter of an upwardly mobile shop keeper. Charles came from Sussex, probably St Leonards, or possibly Kent, maybe Maidstone (depending which census return you happen to be reading). Charles is described as a painter (he was never an ‘RA’ but he was more than proficient), organist and teacher of music. Laudable, but hardly a high earner, one would imagine. Millie is described, of course, as ‘wife’.


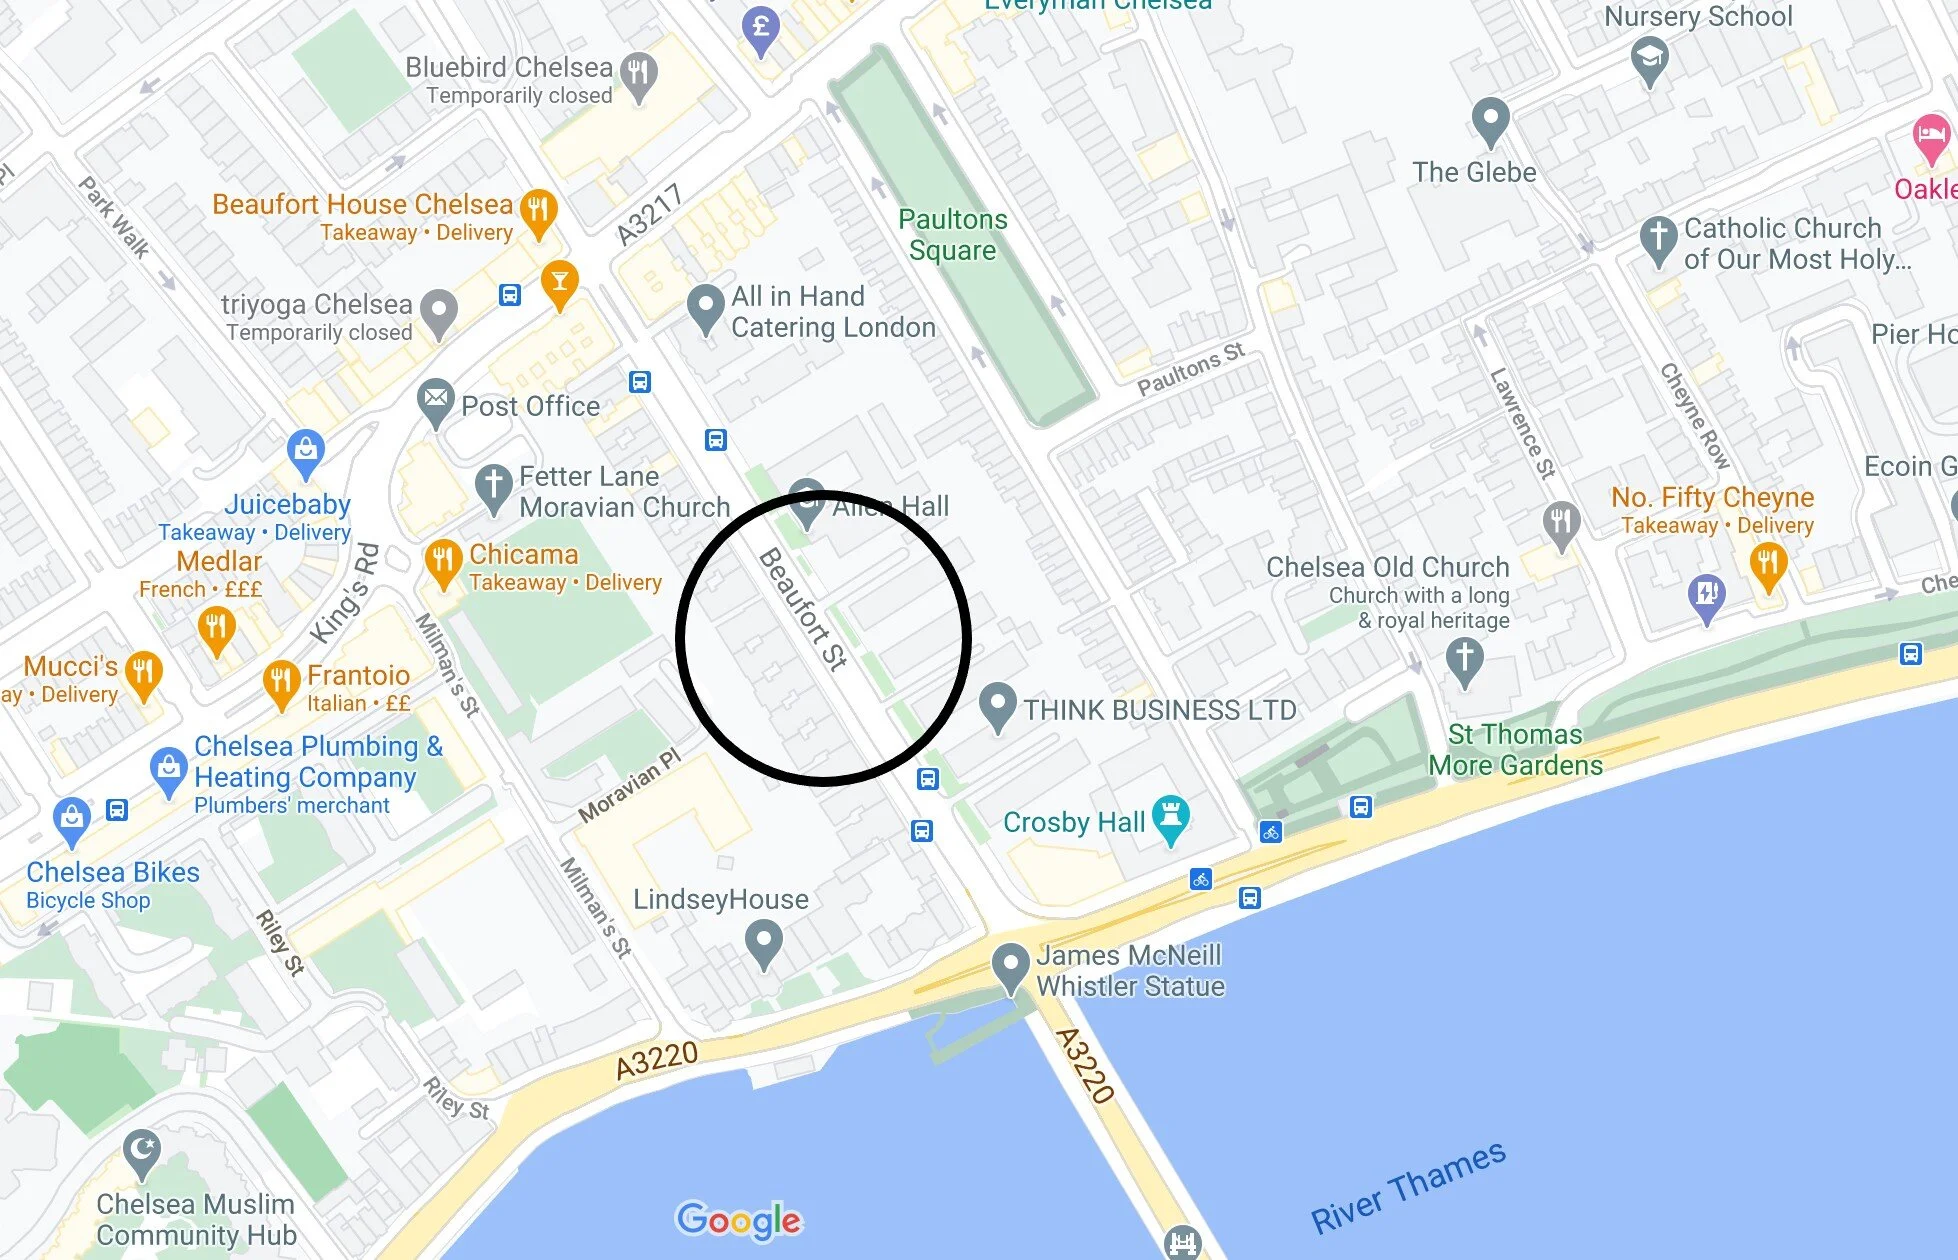
Beaufort Street runs from the northern side of Battersea Bridge, where the Chelsea Embankment meets Cheyne Walk (yes, really, the Cheyne Walk), and heads north westwards, crossing the Kings Road, to end at its junction with the Fulham Road (the A308). Feed that address into Google Maps and it takes you to flat 29, Beaufort Mansions, one of a spectacular line of purpose built apartments which just shouts Chelsea.


For various reasons (!) none of this feels right, so the next stop is the Ordnance Survey Six-inch England and Wales series, 1842-1952, which produces two contrasting images: the 1912/13 revision (left) shows the layout of Beaufort Road as we know it today, but the 1893/95 edition (right) shows a completely different layout. Welcome to the world of Millie and Charles in 1891.


'Reproduced with the permission of the National Library of Scotland' https://maps.nls.uk/index.html
So what did the Poverty Survey make of Beaufort Road in the late 1890s? The Poverty Map – which also confirms the layout shown on the Ordnance Survey 1893/95 edition - indicates that Millie and Charles were on a street labelled ‘Middle Class, Well to do’, no doubt to the relief of Millie’s father who had by now trained himself as an accountant and was a pillar of Cambridge society. But the area is not homogeneous. Yes, there is a lot of red shadings (from Millie’s ‘Well to do’ to ‘fairly comfortable/good ordinary earnings’ to ‘mixed, some comfortable, others poor’ but the blue/greys of the ‘poor’ are certainly in evidence and the local work house (now the Westminster and Chelsea Hospital) is only half a mile away. The ‘vicious, semi criminal class’ is not a significant element of the locality and there is only slight evidence of the ‘wealthy’, although an enclave of yellow, around Elm Park Gardens (just north of the words Park Chapel, on the map), is a similar distance from Millie and Charles as the work house. Perhaps the best conclusion one can draw is that the inhabitants of the area around Beaufort Street, in the middle 1890s, was a classic London socio economic mix.

Extract from Booth’s Maps Descriptive of London Poverty, 1898-9 Beaufort Street, Chelsea and local area
But there is somethig else you need to know about Millie’s life in Beaufort Sreet. Millie, Charles and the baby did not live alone. According to the 1891 census, no less than nine poeple lived at No. 29, and Millie (for it surely it would have been Millie’s role?) was responsible for four boarders and two domestic servants. Unsurprisingly, she probably needed to raise an income, to keep their little ship afloat. The boarders were all male and each poses intriuging questions about the locality. The first mentioned is described as ‘Professor [sic] d’Ecole Normal [sic]’ which would usually translate as a teacher or lecturer at a teacher training college. Was Emile working for, or linked to, the Institut Francais, just a mile away in South Kensington? Or did Chelsea boast a French training college of it’s own? If you know, please tell us in the comment box below. William (28) and Henry (18) are both listed as students of metallurgy. Again, where did they study? Was this the Royal School of Mines (later to become a component of Imperial College when it was founded in 1907), also in Kensington? Again, information please. Finally, 21 year old Hubert is listed as a ‘jeweller’s assistant’ and someone has pencilled in the word ‘gold’ on the census return, lest you should think he was just any old jeweller’s assistant. Perhaps Millie chose her tenants with care. Two teenagers, Elizabeth and Sarah Jane (described as servants), were no doubt Millie’s subordinates in what must have felt like a never ending campaign to keep the house clean, the boarders fed and the family clothed and out of debt. She may also have been pregnant with their second child at the time of the census. Poor Millie - it sounds as though she is working far harder than her artistic husband, while he is probably exacerbating things by taking a money earning room out of commission to use as studio. Millie is not unusual. however. Next door, at no. 31, there is a similar arrangement: a widow with two grown up daughters, four boarders (two men and two women) and a single domestic servant.
By 1901, Millie, Charles and the children have moved on to Fulham (and we will explore the implications of this relocation another time) but what has happened to Beaufort Street, in the meantime? We know that by the early part of the century, large sections of the road had been redeveloped with blocks of flats. Currently a one room studio flat with small kitchen and bathroom is valued at around £400,000 and a four bedroom flat for around £1.6 million pounds. But has the pattern of a comfortable Beaufort Street located within a mixed area continued, or do the 2019 Indices of Deprivation maps tell a different story?

2019 Index of Multiple Deprivation for Beaufort Street and Neighbourhood From: Indices of Deprivation: 2019 and 2015 http://dclgapps.communities.gov.uk/imd/iod_index.html#
Obviously any superficial comparison between the current Multiple Deprivation Indices (above) and the Booth Poverty Maps for the same area, is laughably crude, but Terroir could not resist the temptation of illustrating both representations of our society’s assessment of poverty and deprivation. We leave you to draw your own conclusions. There does, however, seem to be a prima facie case for saying that the area is still a complex mix and that a thougoughly modern Millie might still be taking in lodgers.